We recently looked more often into compute shader optimizations on AMD platforms. Additionally I had a UCSD class in Winter that dealt with this topic and a talk at the Sony booth at GDC 2014 that covered the same topic.
This blog post covers a common scenario while implementing a post-processing pipeline: Parallel Reduction. It uses the excellent talk given by Mark Harris a few years back as a starting point, enriched with new discoveries, credited to the new hardware platforms and AMD specifics.
The topics covered are:

On an algorithmic level, Parallel Reduction looks like a tree-based approach:

Instead of building a fully recursive kernel, which is not possible on current hardware, the algorithm mimics recursion by using a for loop.
As you will see later on, the fact that each of the invocations utilizes less threads from a pool of threads in a thread group, has some impact on performance. Let's say we allocate 256 threads in a thread pool, only the first iteration of the Parallel Reduction algorithm will use all of them. The second iteration -based on the implementation- might only use half of them and the next one again half of those etc..
The changes are marked in red. While on previous hardware generations, this slight change in source code had some impact on the performance, it looks like on modern AMD GPUs it doesn't seem to make a difference anymore. All the measurements were done on an AMD RADEON(TM) HD 6770, an AMD RADEON(TM) HD 7750 and an AMD RADEON(TM) HD 7850:

In case of our example program re-arranging the access pattern doesn't make a difference. It might be that the driver re-arranges the code already or the hardware re-directs the accesses.
Unroll the Loops
A likely overhead of the shaders shown above is the instruction overhead of ancillary instructions that are not loads, stores, or arithmetic instructions for core computations. In other words address arithmetic and loop instructions overhead.
Thread groups that access Thread Group Shared Memory are automatically broken down into hardware schedulable groups of threads. In case of NVIDIA, those are called Warps and there are 32 threads in a warp, and in case of AMD they are called a Wavefront and there are 64 threads in a wavefront (there is a finer level of granularity regarding Wavefronts that we won't cover here). Instructions are SIMD synchronous within a Warp or Wavefront. That means as long as the number of threads executed are below 32 for NVIDIA or below 64 on AMD, a memory barrier is not necessary.
In case of the tree like algorithm that is used for Parallel Reduction as shown in Image 2, the number of threads utilized in a loop are decreasing. As soon as they are below 32 or 64, a memory barrier shouldn't be necessary anymore.
This means that unrolling loops not only might save some ancillary instructions but also might reduce the number of memory barriers used in a compute shader. Source code for an unrolled loop might look like this:
The performance numbers for this optimization show that older hardware appreciates the effort of unrolling the loop and decreasing the number of memory barriers more than newer designs:

Pre-fetching two Color Values into Shared Memory
When looking at the previous shader, the only operation that utilizes all 256 threads in the thread group is the first load into shared memory. By fetching two color values from device memory and adding them already at the beginning of the shader, we could utilize the threads better.
To stay consistent with the previous Parallel Reduction shaders and offering the same 1080p to 120x68 reduction, the following shader only uses 64 threads in the thread group.
Because the number of threads used is 64, memory barriers are not necessary.

It seems that throughout the hardware generations, the performance benefits from fetching two values at the same time, although the number of threads per thread group were reduced to 64 from 256 are appreciated. The reduced number of threads will become a topic later on.
Pre-fetching four Color Values into Shared Memory
With the success story behind fetching two color values into TGSM, the obvious question arises, what would happen if four values would be fetched. To keep the Parallel Reduction algorithm comparable, so that it reduces from 1080p to 120x68, the threads in the thread group are reduced again.
The following shader only uses 16 threads per thread group and is therefore considered not efficient in this respect. The official rule of thumb is using a multiply of 64. On the bright side it doesn't use any memory barriers.
The performance increase compared to the previous shader shows a nearly linear increase:

Looking at the improvements of fetching four instead of two color values brings up the question, how would performance change if the number of threads in a thread group would be increased and the number of thread groups in the dispatch then decreased, which also leads to a higher parallel reduction because the resulting image is smaller.
The next example increases the number of threads from 16 to 64:
Similar to the previous shader this shader avoids any memory barriers but it runs with 64 instead of 16 threads and it is not executed as often, because the grid size was reduced to 60 x 34.

This blog post covers a common scenario while implementing a post-processing pipeline: Parallel Reduction. It uses the excellent talk given by Mark Harris a few years back as a starting point, enriched with new discoveries, credited to the new hardware platforms and AMD specifics.
The topics covered are:
- Sequential Shared Memory (TGSM) Access: utilizing the Memory bank layout
- When to Unroll Loops in a compute shader
- Overhead of address arithmetic and loop instructions
- Skipping Memory Barriers: Wavefront
- Pre-fetching data into Shared Memory
Most of the examples accompanying this blog post are showing a simple parallel reduction going from 1080p to 120x68. While reducing the size of the image, these examples also reduce the color color value to luminance.
Image 1 - Going from 1080p to 120x68 and from Color to Luminance
On an algorithmic level, Parallel Reduction looks like a tree-based approach:
Image 2 - Tree-based approach for Parallel Reduction
Instead of building a fully recursive kernel, which is not possible on current hardware, the algorithm mimics recursion by using a for loop.
As you will see later on, the fact that each of the invocations utilizes less threads from a pool of threads in a thread group, has some impact on performance. Let's say we allocate 256 threads in a thread pool, only the first iteration of the Parallel Reduction algorithm will use all of them. The second iteration -based on the implementation- might only use half of them and the next one again half of those etc..
TGSM Access: Utilizing the Memory bank layout
One of the first rules of thumb mentioned by Nicolas Thibieroz is dealing with the access pattern that is used to access TGSM. There is only a limited number of I/O banks and they need to be utilized in the most efficient way. It turns out that AMD and NVIDIA seem to have both 32 banks.

Accessing TGSM with addresses that are 32 DWORD apart will lead to a situation where threads will use the same bank. This generates so called bank conflicts. In other words, accessing the same address from multiple threads creates bank conflicts.
The preferred method to access TGSM is to have 32 threads use 32 different banks. Usually the extreme example mentioned is the 2D array example, where you want to access memory by increasing the bank number first -you might consider this moving horizontally- and then increase the vertical direction. This way threads will hit different banks more often.
The more subtle bank conflicts happen when memory banks are accessed in non-sequential patterns. Mark Harris has shown the following example. Here is an image depicting this:

The first example source is showing an implementation of this memory access pattern:
if (index < (groupthreads))
This code fetches TGSM in its for loop in a pattern as showed in Image 4. The image of a sequential access pattern is supposed to look like this:

The source code of the sequential access version looks like this:
Image 3 - Memory banks are arranged linearly with addresses
Accessing TGSM with addresses that are 32 DWORD apart will lead to a situation where threads will use the same bank. This generates so called bank conflicts. In other words, accessing the same address from multiple threads creates bank conflicts.
The preferred method to access TGSM is to have 32 threads use 32 different banks. Usually the extreme example mentioned is the 2D array example, where you want to access memory by increasing the bank number first -you might consider this moving horizontally- and then increase the vertical direction. This way threads will hit different banks more often.
The more subtle bank conflicts happen when memory banks are accessed in non-sequential patterns. Mark Harris has shown the following example. Here is an image depicting this:
Image 4 - Memory banks accessed interleaved
//
Example for Interleaved Memory access
[numthreads(THREADX,
THREADY, 1)]
void PostFX(
uint3 Gid : SV_GroupID,
uint3 DTid : SV_DispatchThreadID,
uint3 GTid : SV_GroupThreadID, uint GI :
SV_GroupIndex )
{
const float4 LumVector =
float4(0.2125f, 0.7154f, 0.0721f, 0.0f);
uint idx = DTid.x + DTid.y * c_width; //
read from structured buffer
sharedMem[GI] =
dot(Input[idx], LumVector); //
store in shared memory
GroupMemoryBarrierWithGroupSync(); //
wait until everything is transfered from
device memory to shared memory
[unroll(groupthreads)]
for (uint s = 1; s < groupthreads; s
*= 2) // stride: 1, 2, 4, 8, 16, 32, 64, 128
{
int index
= 2 * s * GI;
if (index < (groupthreads))
sharedMem[index] += sharedMem[index
+ s];
GroupMemoryBarrierWithGroupSync();
}
// Have the first thread write out to the
output
if (GI == 0)
{
// write out the result for each thread
group
Result[Gid.xy] = sharedMem[0] /
(THREADX * THREADY);
}
}
Image 5 - Memory banks accessed sequential
The source code of the sequential access version looks like this:
[numthreads(THREADX,
THREADY, 1)]
void PostFX(
uint3 Gid : SV_GroupID,
uint3 DTid : SV_DispatchThreadID,
uint3 GTid : SV_GroupThreadID, uint GI :
SV_GroupIndex )
{
const float4 LumVector =
float4(0.2125f, 0.7154f, 0.0721f, 0.0f);
uint idx = DTid.x + DTid.y * c_width; //
read from structured buffer
sharedMem[GI] =
dot(Input[idx], LumVector); //
store in shared memory
GroupMemoryBarrierWithGroupSync(); //
wait until everything is transfered from
device memory to shared memory
[unroll(groupthreads / 2)]
for (uint s = groupthreads / 2; s
> 0; s >>= 1)
{
if (GI < s)
sharedMem[GI] += sharedMem[GI +
s];
GroupMemoryBarrierWithGroupSync();
}
// Have the first thread write out to the
output
if (GI == 0)
{
// write out the result for each thread
group
Result[Gid.xy] = sharedMem[0] /
(THREADX * THREADY);
}
}
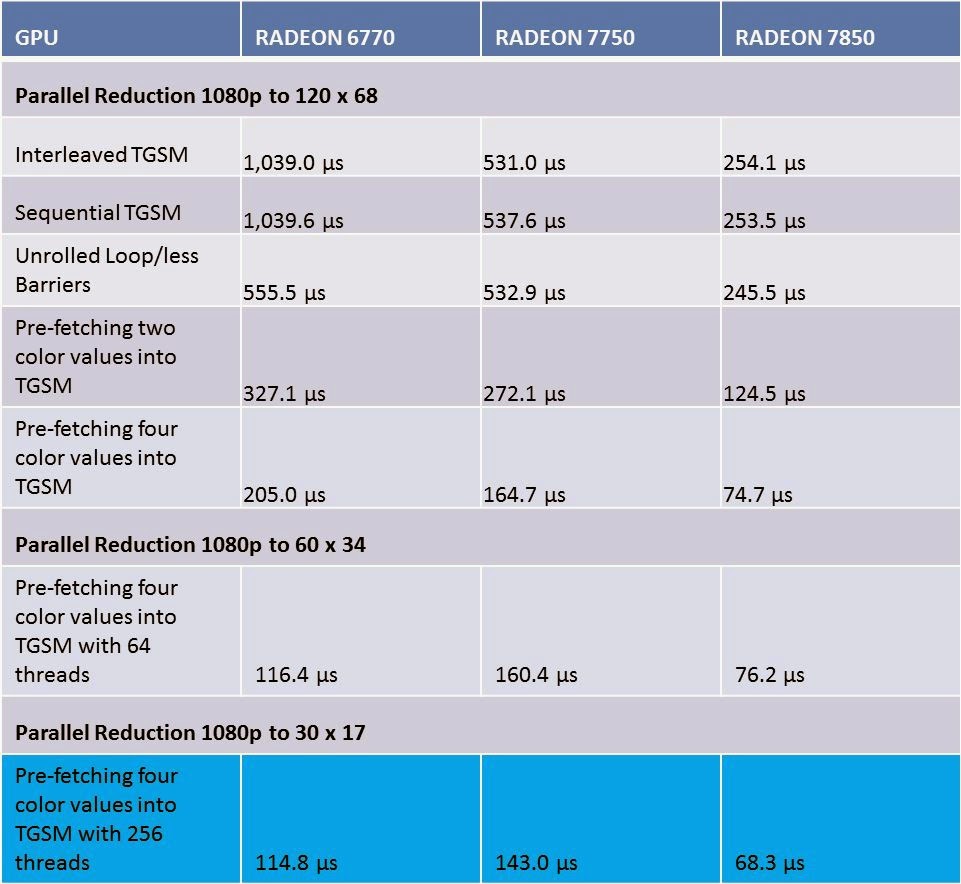
The changes are marked in red. While on previous hardware generations, this slight change in source code had some impact on the performance, it looks like on modern AMD GPUs it doesn't seem to make a difference anymore. All the measurements were done on an AMD RADEON(TM) HD 6770, an AMD RADEON(TM) HD 7750 and an AMD RADEON(TM) HD 7850:
Image 5 - Peformance of Interleaved / Sequential TGSM access pattern
Unroll the Loops
A likely overhead of the shaders shown above is the instruction overhead of ancillary instructions that are not loads, stores, or arithmetic instructions for core computations. In other words address arithmetic and loop instructions overhead.
Thread groups that access Thread Group Shared Memory are automatically broken down into hardware schedulable groups of threads. In case of NVIDIA, those are called Warps and there are 32 threads in a warp, and in case of AMD they are called a Wavefront and there are 64 threads in a wavefront (there is a finer level of granularity regarding Wavefronts that we won't cover here). Instructions are SIMD synchronous within a Warp or Wavefront. That means as long as the number of threads executed are below 32 for NVIDIA or below 64 on AMD, a memory barrier is not necessary.
In case of the tree like algorithm that is used for Parallel Reduction as shown in Image 2, the number of threads utilized in a loop are decreasing. As soon as they are below 32 or 64, a memory barrier shouldn't be necessary anymore.
This means that unrolling loops not only might save some ancillary instructions but also might reduce the number of memory barriers used in a compute shader. Source code for an unrolled loop might look like this:
… //
like the previous shader
if (groupthreads
>= 256)
{
if (GI < 128)
sharedMem[GI] += sharedMem[GI +
128];
GroupMemoryBarrierWithGroupSync();
}
// AMD -
64 / NVIDIA - 32
if (GI
< 64)
{
if (groupthreads >= 64) sharedMem[GI] += sharedMem[GI + 32];
if (groupthreads >= 64) sharedMem[GI] += sharedMem[GI + 32];
if (groupthreads
>= 32) sharedMem[GI]
+= sharedMem[GI +
16];
if (groupthreads >= 16)sharedMem[GI]
+= sharedMem[GI +
8];
if (groupthreads >= 8)sharedMem[GI]
+= sharedMem[GI +
4];
if (groupthreads >= 4)sharedMem[GI]
+= sharedMem[GI +
2];
if (groupthreads >= 2)sharedMem[GI]
+= sharedMem[GI +
1];
}
…The performance numbers for this optimization show that older hardware appreciates the effort of unrolling the loop and decreasing the number of memory barriers more than newer designs:
Image 6 - Unrolled Loops / Less Memory Barriers performance Impact
Pre-fetching two Color Values into Shared Memory
When looking at the previous shader, the only operation that utilizes all 256 threads in the thread group is the first load into shared memory. By fetching two color values from device memory and adding them already at the beginning of the shader, we could utilize the threads better.
To stay consistent with the previous Parallel Reduction shaders and offering the same 1080p to 120x68 reduction, the following shader only uses 64 threads in the thread group.
…
//
pack two values
//
like the previous shader
//
store in shared memory
float
temp = (dot(Input[idx *
2], LumVector) +
dot(Input[idx * 2
+ 1], LumVector));
sharedMem[GI]
= temp;
//
AMD - 64 / NVIDIA - 32
if
(GI < 32)
{
if (groupthreads
>= 32) sharedMem[GI]
+= sharedMem[GI +
16];
if (groupthreads >= 16)sharedMem[GI]
+= sharedMem[GI +
8];
if (groupthreads >= 8)sharedMem[GI]
+= sharedMem[GI +
4];
if (groupthreads >= 4)sharedMem[GI]
+= sharedMem[GI +
2];
if (groupthreads >= 2)sharedMem[GI]
+= sharedMem[GI +
1];
}
…
Because the number of threads used is 64, memory barriers are not necessary.
Image 7 - Pre-fetching two color values
It seems that throughout the hardware generations, the performance benefits from fetching two values at the same time, although the number of threads per thread group were reduced to 64 from 256 are appreciated. The reduced number of threads will become a topic later on.
Pre-fetching four Color Values into Shared Memory
With the success story behind fetching two color values into TGSM, the obvious question arises, what would happen if four values would be fetched. To keep the Parallel Reduction algorithm comparable, so that it reduces from 1080p to 120x68, the threads in the thread group are reduced again.
The following shader only uses 16 threads per thread group and is therefore considered not efficient in this respect. The official rule of thumb is using a multiply of 64. On the bright side it doesn't use any memory barriers.
…
//
pack four values
#define
THREADX 4
#define
THREADY 4
…
// like
the previous shader
float
temp
= (dot(Input[idx *
4], LumVector) +
dot(Input[idx * 4
+ 1], LumVector))
+ (dot(Input[idx * 4
+ 2], LumVector) +
dot(Input[idx * 4
+ 3], LumVector));
// store
in shared memory ->
no group barrier
sharedMem[IndexOfThreadInGroup] =
temp;
// AMD -
64 / NVIDIA - 32
if (IndexOfThreadInGroup <
16)
{
if (groupthreads >= 16)sharedMem[IndexOfThreadInGroup] += sharedMem[IndexOfThreadInGroup +
8];
if (groupthreads >= 8)sharedMem[IndexOfThreadInGroup] += sharedMem[IndexOfThreadInGroup +
4];
if (groupthreads >= 4)sharedMem[IndexOfThreadInGroup] += sharedMem[IndexOfThreadInGroup +
2];
if (groupthreads >= 2)sharedMem[IndexOfThreadInGroup] += sharedMem[IndexOfThreadInGroup +
1];
}
…
The performance increase compared to the previous shader shows a nearly linear increase:
Image 8 - Pre-fetching four color values
Looking at the improvements of fetching four instead of two color values brings up the question, how would performance change if the number of threads in a thread group would be increased and the number of thread groups in the dispatch then decreased, which also leads to a higher parallel reduction because the resulting image is smaller.
The next example increases the number of threads from 16 to 64:
…
// pack four values
#define THREADX 8
#define THREADY 8
…
// like the previous shader
float temp = (dot(Input[idx * 4], LumVector) + dot(Input[idx * 4 + 1], LumVector))
+ (dot(Input[idx * 4 + 2], LumVector) + dot(Input[idx * 4 + 3], LumVector));
// store in shared memory > no group barrier
sharedMem[IndexOfThreadInGroup] = temp;
// AMD - 64 / NVIDIA - 32
if (IndexOfThreadInGroup < 64)
{
if (groupthreads >= 64)sharedMem[IndexOfThreadInGroup] += sharedMem[IndexOfThreadInGroup + 32];
if (groupthreads >= 32)sharedMem[IndexOfThreadInGroup] += sharedMem[IndexOfThreadInGroup + 16]; if (groupthreads >= 16)sharedMem[IndexOfThreadInGroup] += sharedMem[IndexOfThreadInGroup + 8];
if (groupthreads >= 64)sharedMem[IndexOfThreadInGroup] += sharedMem[IndexOfThreadInGroup + 32];
if (groupthreads >= 32)sharedMem[IndexOfThreadInGroup] += sharedMem[IndexOfThreadInGroup + 16]; if (groupthreads >= 16)sharedMem[IndexOfThreadInGroup] += sharedMem[IndexOfThreadInGroup + 8];
if (groupthreads >= 8)sharedMem[IndexOfThreadInGroup] += sharedMem[IndexOfThreadInGroup + 4];
if (groupthreads >= 4)sharedMem[IndexOfThreadInGroup] += sharedMem[IndexOfThreadInGroup + 2];
if (groupthreads >= 2)sharedMem[IndexOfThreadInGroup] += sharedMem[IndexOfThreadInGroup + 1];
}
…
Image 9 - Increasing the number of Threads from 16 to 64 and decreasing the size of the result
Although the number of threads are increased, the workload of this shader is also increased due to halving the size of the resulting image in each direction. In other words this shader does more work than the previous shaders. This allows the conclusion that this shader runs faster than the previous one.
Following the successful path of increasing the number of threads, the last shader in this blog post will use 256 threads to parallel reduce the image size from 1080p to 30x17.
... // like the previous shaders
// store in shared memory
sharedMem[IndexOfThreadInGroup] = temp;
// wait until everything is transfered from device memory to shared memory
GroupMemoryBarrierWithGroupSync();
if (groupthreads >= 256)
{
if (IndexOfThreadInGroup < 128)
sharedMem[IndexOfThreadInGroup] += sharedMem[IndexOfThreadInGroup + 128];
GroupMemoryBarrierWithGroupSync();
}
// AMD - 64 / NVIDIA - 32
if (IndexOfThreadInGroup < 64)
{
if (groupthreads >= 64)sharedMem[IndexOfThreadInGroup] += sharedMem[IndexOfThreadInGroup + 32];
if (groupthreads >= 32)sharedMem[IndexOfThreadInGroup] += sharedMem[IndexOfThreadInGroup + 16];
if (groupthreads >= 16)sharedMem[IndexOfThreadInGroup] += sharedMem[IndexOfThreadInGroup + 8];
if (groupthreads >= 8)sharedMem[IndexOfThreadInGroup] += sharedMem[IndexOfThreadInGroup + 4];
if (groupthreads >= 4)sharedMem[IndexOfThreadInGroup] += sharedMem[IndexOfThreadInGroup + 2];
if (groupthreads >= 2)sharedMem[IndexOfThreadInGroup] += sharedMem[IndexOfThreadInGroup + 1];
}
...
With the increased number of threads we have to add memory barriers again. Nevertheless this shader runs quicker than all the previous shaders while -at the same time- doing more work:
Image 10 - Increasing the number of Threads from 64 to 256 and decreasing the size of the result
Please note how the older GPU starts beating the newer GPU when the number of threads are increased. Overall for the 6770, we went from roughly 1 ms to close to a tenth of the original time frame. For the 7750 and the 7850 we ended up reducing the frame time to roughly a bit more than a fourth, while increasing the workload in the last two test setups.
Conclusion
Like with most optimization tasks there is always more to consider and more to try out. A list of things that would be worth considering is still short but give some time, it will increase.
If you -the valued reader of this blog- have anything you want me to try and add to this list, please let me know and I will add it to this blog post.
Overall I believe the case studies shown above should give someone a good starting point to optimize the Parallel Reduction part of a post-processing pipeline.
One other topic crucial for the performance of a post-processing pipeline is the speed of the blur kernel. Optimizations that lead to the "ultimate" blur kernel will have to wait for a future blog post :-)
Thanks to Stephan Hodes from AMD for providing feedback.
No comments:
Post a Comment